Day 1 TSA Homework
Quiz Summary
0 of 20 Questions completed
Questions:
Information
You have already completed the quiz before. Hence you can not start it again.
Quiz is loading…
You must sign in or sign up to start the quiz.
You must first complete the following:
Results
Results
0 of 20 Questions answered correctly
Your time:
Time has elapsed
You have reached 0 of 0 point(s), (0)
Earned Point(s): 0 of 0, (0)
0 Essay(s) Pending (Possible Point(s): 0)
Categories
- Not categorized 0%
| Pos. | Name | Entered on | Points | Result |
|---|---|---|---|---|
| Table is loading | ||||
| No data available | ||||
- 1
- 2
- 3
- 4
- 5
- 6
- 7
- 8
- 9
- 10
- 11
- 12
- 13
- 14
- 15
- 16
- 17
- 18
- 19
- 20
- Current
- Review
- Answered
- Correct
- Incorrect
-
Question 1 of 20
1. Question
The University of Australia has five degree programs. In each program, there are 500 graduating students. John, a member of the school staff, keeps track of the number of students who have already claimed their togas for graduation. Shown in the table is the number of students per program who have already claimed their togas.
Program
Business
Engineering
Architecture
Medicine
Computer
Value
384
477
293
362
458
Which of the following pie charts best represents the data in the table?
CorrectIncorrect -
Question 2 of 20
2. Question
Christine, a bakeshop owner, was keeping track of the customers that purchased her products. She has been keeping track of the number of her customers during weekdays based on their orders. The results are tallied below.
Order
Monday
Tuesday
Wednesday
Thursday
Friday
Oreo Cheesecake
11
60
9
18
24
Red Velvet
20
40
55
35
35
Carrot Cake
25
44
34
32
33
Vanilla Cake
34
50
13
13
11
Which of the following line charts best represents the total number of people per monthly range?
CorrectIncorrect -
Question 3 of 20
3. Question
The bar chart shows Brandon’s electricity bills for the past 6 months.

Which consecutive months had the biggest difference in Brandon’s electricity bills?
CorrectIncorrect -
Question 4 of 20
4. Question
Nemo tracked the number of clams he collects every deep ocean diving session he has regularly with his friends. He kept his data on a table and a bar chart.
Session 1
Session 2
Session 3
Session 4
Session 5
Session 6
60
63
65
70
68
70
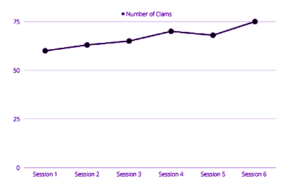
Does the line graph accurately represent the number of clams collected by Nemo as provided by the data in the table?
CorrectIncorrect -
Question 5 of 20
5. Question
Allan works at an appliance store in Ayala Mall. He wanted to know the best-selling television brand in their store, which is why he kept a tally of the number of people who bought from each brand during the month of September. The results are shown in the table.
Brand
Sony
Samsung
LG
Panasonic
TCL
Value
21
28
36
27
19
Which of the following pie charts best represents the data in the table if the purple portion represents TCL?
CorrectIncorrect -
Question 6 of 20
6. Question
Veronica was working as a fitness coach at a local gym around their community. She has been keeping track of the number of people that had a gym membership every month based on their age range. The results are tallied below.
Age Range
May
June
July
August
September
18-24
15
6
12
19
9
25-30
25
8
10
7
15
31-40
10
20
11
8
12
41 Above
7
14
15
10
11
Which of the following line charts best represents the total number of people per monthly range?
CorrectIncorrect -
Question 7 of 20
7. Question
There are a total of 234 Year 4 students in Statefields School Inc. They are divided equally into 6 classes. Ms. Kryssten, the science teacher, created a tally of the number of students who failed their science class. The results are shown in the table below.
Class
Class A
Class B
Class C
Class D
Class E
Class F
Value
4
7
12
8
3
5
Which of the following pie charts best represents the number of students per class who passed their science class?
CorrectIncorrect -
Question 8 of 20
8. Question
Gerah was looking into the archives of her company’s past revenue records from 2003 to 2007. She saw this data in a bar chart.
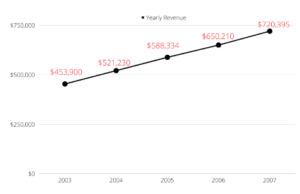
Which of the following consecutive years had the smallest difference in the company’s yearly revenue?
CorrectIncorrect -
Question 9 of 20
9. Question
Allie is a farm owner. She keeps track of the number of egg trays that are being delivered each day of the week. The table shows the total number of egg trays delivered each day.
Day
Monday
Tuesday
Wednesday
Thursday
Friday
Value
332
319
368
342
339
Her husband wants to see a bar chart representation of the data.
Which of the following bar charts best represents the data in the table?
CorrectIncorrect -
Question 10 of 20
10. Question
Hades needs to buy 12 bottles of soda for his water rocket science project. There are four shops that offer the product he wants. The shops, prices, and other special offers are shown in the table.
SHOP
STANDARD PRICE
SPECIAL OFFERS
Art Needs Co.
$5
Buy 3 Get 1
Everything Science
$4
10% off on total price
Props Centre
$3
No Special Offer
Physics Store
$4
5% off on total price
What is the difference between the most expensive and cheapest store?
CorrectIncorrect -
Question 11 of 20
11. Question
The bar chart shows the representation of Ellie’s expenses for the month of August.
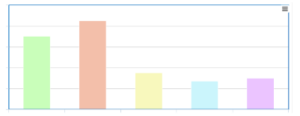
Which of the following data sets best matches the contents of the bar chart?
CorrectIncorrect -
Question 12 of 20
12. Question
Shane is going to the Country Fair with her friends. In order to play in the different booths, she must have tokens.
Promo 1 costs $10 and includes 10 tokens.
Promo 2 costs $5 and includes 5 tokens.
Promo 3 costs $3 and includes 3 tokens.
Each booth at the fair requires a different number of tokens.
Shane is planning to play in 8 different booths. Three booths require 8 tokens each, three other booths require 6 tokens each, and two booths require 5 tokens each. Greyson gave Shane 4 tokens. She wants to spend the least amount of credits that would allow her to play in 8 different booths. Moreover, she also wants to avail the least number of promos.
How much in total should Shane spend?
CorrectIncorrect -
Question 13 of 20
13. Question
Jojo owns a hardware store in the Metro. His earnings in the month of June were represented in a bar chart. Unfortunately, he misplaced the paper where the raw data was written.
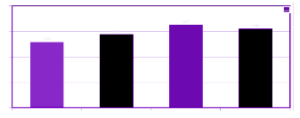
Which of the following data sets best matches the bar chart?
CorrectIncorrect -
Question 14 of 20
14. Question
Brian owns a grocery store. Every week, he has a special offer on some of the products in his store.
He advertises these offers by comparing his prices with one of the other local grocery stores. Each week, the comparison is based on the ingredients for a certain food dessert.
This week, the comparison will be based on fruit salad. The ingredients and their prices at the other local grocery store are shown in the table below.
ITEM
PRICE OF THE ITEM IN ANOTHER LOCAL GROCERY STORE
Fruit Cocktail
$14.60
Condensed Milk
$2.10
Heavy Cream
$4.30
One of each item is needed to make the dessert. Brian wants to advertise that his items are 20% cheaper in total. He also decided that he will sell the fruit cocktail for $11.50 and the condensed milk for $1.60.
At what price should he sell the heavy cream?
CorrectIncorrect -
Question 15 of 20
15. Question
Manny works as a security guard at Statefields School Inc. He keeps a tally of the number of students who are tardy everyday for the whole week. At the end of the week, he creates a pie chart representation to be submitted to the guidance office. The results are shown in the table.
Year
Year 2
Year 3
Year 4
Year 5
Value
16
21
19
24
Which of the following pie charts best represents the data in the table if the red portion represents Year 3?
CorrectIncorrect -
Question 16 of 20
16. Question
Brittanie wants to buy 20 flower pots for her garden at home. There are 4 shops that offer the pots she wants. The shops, prices of the post, and other special offers are shown in the table below.
SHOP
STANDARD PRICE
PROMO
SHOP A
$6
10% off on total price
SHOP B
$9
Buy 1 Get 1 Promo
SHOP C
$4
No Promo
SHOP D
$5
50% off on 10th and 20th item
Brittanie is on a budget and wants to spend as little as possible.
In which shop should Brittanie buy her flower pots?
CorrectIncorrect -
Question 17 of 20
17. Question
Maya works at an electronics store. For the month of December, they offered a 15% discount on most of their items. She created a bar chart representation of the number of people who bought some of the expensive items in their store during the month of December. The chart is shown below.
The store owner asked Maya to give him the raw data so he could compute the total earnings from the sales.
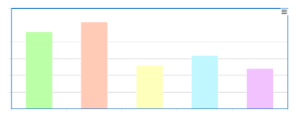
Which of the following data sets best matches the bar chart?
CorrectIncorrect -
Question 18 of 20
18. Question
Mindy works at Shangri-La Sydney. She manages the bookings and booking cancellations. A reservation can only be cancelled 3 or more days before the reserved date.
Shown in the table are the names of the people, reserved date, and date of cancellation.
NAME OF CUSTOMER
DATE OF CANCELLATION
RESERVED DATE
Michelle Lopez
August 2, 2022
August 16, 2022
Michael Anderson
August 10, 2022
August 12, 2022
Kristoff Stanford
August 19, 2022
August 21, 2022
Kim Lee
September 3, 2022
September 14, 2022
Sana Minatozaki
September 14, 2022
September 28, 2022
Momo Hirai
September 18, 2022
September 19, 2022
How many people would be approved for a booking cancellation?
CorrectIncorrect -
Question 19 of 20
19. Question
Alisa and her mom went to the mall to buy some school supplies. When they got home, Alisa got the receipt from the paper bag and made a pie chart representation of the cost of the items. The pie chart is shown below.
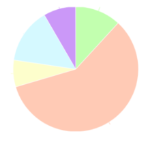
When her mom saw this, she asked for the receipt back, but unfortunately, Alisa misplaced it after creating the pie chart.
Which of the following data sets best matches the partition in the pie chart if the purple portion represents Bond Paper?
CorrectIncorrect -
Question 20 of 20
20. Question
Due to COVID-19, airports are changing their rules. People would only be allowed to travel if they have been vaccinated at least 1 week before their flight date. People’s details are shown in the table below.
NAME
DATE OF VACCINATION
FLIGHT DATE
KRIELLE
January 3, 2021
January 18, 2021
PRAYAH
January 16, 2021
January 29, 2021
ZARIF
February 18, 2021
February 21, 2021
MISHCA
February 26, 2021
February 28, 2021
REI
March 3, 2021
March 18, 2021
ZARAH
March 14, 2021
March 20, 2021
JOHN
March 23, 2021
March 31, 2021
How many people would be allowed to travel?
CorrectIncorrect